The impact of the coronavirus pandemic on the global economy is sobering. Job losses in the United States due to COVID-19 are the highest since the Great Depression. Some sources cite nearly 20.6 million jobs have been lost since mid-March in the U.S., resulting in an unemployment rate of nearly 15%. Other sources cite more than 40 million job losses domestically. On the global scale, the UN Labor Agency has reported that nearly half the global workforce is at risk of losing income due to coronavirus. Could you imagine? Billions of people without work, without income, without the ability to provide for their families. It is a reality unfolding before our very eyes – not just in America, but around the world.
And job losses have hit virtually every industry – Information Technology is no exception. Although our industry has not been destroyed like the retail and service sectors, the ripple affect can be felt. Organizations with historically deep IT budgets are suddenly tightening their belts. Incredibly talented VPs and CIOs have been let go, experienced Quality Assurance & Testing Analysts have lost their jobs, and startups are going belly up seemingly overnight as investment markets freeze up. If you take the time to monitor LinkedIn posts, you can see post-after-post of applicants flooding the job market seeking employment.
Of course, you are going to hear the opposite in different circles. Some are saying that IT spending is ramping up despite COVID and companies are realizing the need to double- or even triple-down on their product development efforts during these trying times. It is a fairy tale narrative that most are hoping everyone will believe to loosen the purse strings, especially software product companies whose very existence depends on continued IT spending. The reality is that every industry is feeling the crunch.
Since the mid-1990s, the craze has always been IT. You would hear people say, “The money is in computers – go to school for that.” Universities across the U.S. expanded their Computer Science departments, while business schools launched “Management Information Systems” (MIS) bachelor’s degree programs. Droves of aspiring students enrolled in these degree programs and flooded the market. Some even aspired to higher levels of education within Information Technology – obtaining master’s degrees and PhDs – striving to separate themselves competitively from the herds of students.
But somewhere along the line, we lost ourselves. As the pressure to deliver software faster was felt, we cut corners, we neglected fundamental truths, and technical debt accrued. Not only did technical debt accrue, but our product brand suffered as defects slipped through to our customers. Our customers’ business operations were impacted because of our negligence and our haste to speed things along to stay ahead of the market. If you are still reading – you are likely guilty as charged. We have all been, at some point in our career.
Maybe COVID is the eye opener that CIOs, DevOps leaders, and Agilists ultimately need to refocus their attention on the efficiency of their value streams first, then quality and speed. Maybe, just maybe, your organization is bloated with inefficient processes, inefficient software, and inefficient people. Whether that’s inefficient behaviors among your staff, or counterproductive mindsets that ultimately leads to substandard outcomes – it is your job to identify not only the inefficiencies, but also the bottlenecks.
And we have the answers to help you. The secret is not your tools, nor is it your processes, or your people. It is not some trendy framework that you read about or an expensive product that will tie it all together. It is a delicate balance of people, process, and technology – harmoniously working together in a way that produces measurable results. It is human and it starts with measurable outcomes.
In ConnectALL’s Ultimate Guide to Lean Metrics in Value Stream Management (2020 Version), you will learn about the history of value stream management and how IT Leaders have adapted fundamental lean concepts from over 70 years ago to software delivery today. We will take you down a journey of why organizations have adopted multi-tooling strategies in their value streams and why business intelligence platforms are a must-have requirement. We will explore common synchronization patterns between the world’s most popular and widely used application lifecycle management (ALM) and Agile planning tools like Atlassian JIRA, Microsoft Azure DevOps, Tricentis TOSCA, and Micro Focus Quality Center/ALM.
Most importantly, this Ultimate Guide is designed to prompt action within your organization. It is not an academic paper with platitudes and theories. And it’s certainly not a marketing brochure with fluff or non-value-added imagery. We have researched, analyzed, and interviewed real practitioners who have led $100m+ projects whose value streams could make or break entire industries like Medicaid and Defense. Their insights are included in our guide to help you understand the importance and criticality of establishing and monitoring lean metrics in your software value stream.
Finally, we have included free SQL code* in our Ultimate Guide for you to copy/paste and try out yourself to start monitoring lean metrics today. It might take a few tweaks here and there, but ConnectALL has done the heavy SQL code lifting on your behalf.
What is Value Stream Management?
Since the 1950s, America led the industrial revolution. For over 40 years, the manufacturing sector in the U.S. dominated globally. Systems thinking and lean principles were widely adopted by manufacturing leaders running everything from tool & die facilities to turbine plants. And for good reason too – these principles were proven by the Japanese and worked. Although America did not invent concepts such as JIT (Just in Time), Kanban, or Continuous Improvement (Kaizen) – we certainly recognized a winning formula and ran with it. By reducing waste, we improved quality and velocity of output – ultimately increasing revenues. Efficiency was the name of the game (and still is).
Plant managers closely monitored lead time, cycle time, WIP (work in progress), and throughput. Astute plant managers also understood the fundamentals of Little’s Law and cautiously monitored the flow of work in their systems – understanding that ‘more’ is not always ‘better’ in terms of throughput. Modern day IT ‘thought leaders’ have simply regurgitated the fundamentals of Little’s Law to state the obvious: reducing WIP can and will reduce cycle time. In other words, do not eat too much in one seating. Too much too soon can wreak havoc on your internal systems.
According to Flint Brenton, a Forbes Council Member, Value Stream Management is a lean business practice that helps determine the value of software development and delivery efforts and resources. In his article entitled, “What is Value Stream Management? A Primer For Enterprise Leadership,” Brenton asserts, “By identifying and examining value streams, instead of ‘features and functions,’ and measuring software delivery success, teams can focus more energy and time on what works and shift away from what doesn’t work. Simply put, value streams make complex processes visible and ready to pivot, if needed, to drive more value.” Gigaom, a widely recognized research firm, reinforces this notion by stating, “Value Stream Management is derived from lean manufacturing principles, in which a delivery process is monitored in terms of its efficiency at each step. This enables unexpected bottlenecks to be identified from a tactical perspective, plus the overall process can be assessed in terms of hand-offs, repetition, and other criteria, enabling the process to be improved as a whole.”
Adopting a Multi-Tool Metrics Strategy
The problem many organizations face today is the wide array of tools in use to facilitate the delivery of software to customers. Agile and DevOps has created an explosion of new tools purported to solve every problem imaginable. Products like IBM DOORS, Atlassian JIRA, Microsoft Azure DevOps, ServiceNow, Tricentis TOSCA, and Micro Focus Quality Center/ALM are mainstays within most software development teams. These tools have proven themselves to be an effective means of solving a specific problem in the software delivery pipeline. A few of these products are marketed as end-to-end platforms with the ability to handle every aspect of software delivery. Open source options are also extremely popular and widely used, but highly regulated industries tend to stick with products like IBM DOORS and Micro Focus Quality Center/ALM. What often occurs, as well, is that organizations will adopt several of these tools at once across their organization. Certain business units have an affinity towards JIRA, whereas others are comfortable using Azure DevOps – but their value streams are codependent – therefore measuring lead time cuts across multiple tools.

For example, integrating Azure DevOps with requirements management tools in the value stream make it easier for businesses and product development teams to coordinate with each other, accelerating delivery cycles and efficiently scaling agile practices. Organizations often integrate Azure DevOps with other tools like Micro Focus Quality Center, but do not have an effective multi-tool metrics strategy. A multi-tool metrics strategy is just that: understanding how you will calculate, measure, and monitor metrics across multiple toolsets. In this guide, we will analyze the metrics that help you improve “flow” through your software development lifecycle, while giving you the specific SQL statements that can be used to set up multi-tool lean metrics in BI tools like Tableau, Microsoft PowerBI, Grafana, and Metabase.
Mainstay Software Tools
If you Google “Agile Planning Tools,” you will see thousands of results with Atlassian JIRA towards the very top, right under the paid advertisements. As you thumb through the pages, you will notice competitor after competitor. With such an expansive market of application developers, many other companies have tried to introduce Agile planning tools to compete with Atlassian JIRA. Some have captured a small sliver of the market, but most have failed to compete with JIRA, other than Microsoft Azure DevOps. The barriers to entry to introduce an Agile planning software tool are quite low but gaining widespread adoption like Atlassian and Microsoft is not so easy as many companies had hoped.
If you Google “Help Desk Tools,” you’ll likely see ZenDesk taking up an ad spot, along with various “review” websites (e.g., comparitech.com) that analyze and list other tools. ServiceNow has established itself as the industry-leading Problem and Incident Management solution, so much so that they don’t even find the need to purchase Google ad space to promote their platform. Ask anyone, at any company, if they have heard of ServiceNow and the odds are that they have either heard of it or are actively using it today in their day-to-day job. The workflow customization capabilities of the platform are powerful and have driven widespread enterprise-level adoption.
If you Google “Quality Assurance and Testing tools,” you will undoubtedly encounter information about Selenium and mention of other tools to help assist with validation, including: Postman, New Relic, etc. Tricentis, a leader in the QA & Testing space, published an article entitled “100+ Best Software Testing Tools Reviewed (Research Done for You!)” that came up in my recent search. At the top of their list includes their very own software called TOSCA, along with Micro Focus UFT (Unified Functional Test). On their list, they also list other tools like IBM Rational Functional Tester (RFT) and Worksoft Certify.
And finally, if you Google search “Requirements Management Tools” – you’ll see an extensive article published by TheDigitalProjectManager that lists Jama, Orcanos, and IBM DOORS as the Top 3 picks. ConnectALL’s Value Stream Integration platform features pre-built adapters for both Jama and IBM DOORS, both of which are excellent tools for managing requirements and much more.
Let’s take a closer look at some well-known tools used by organizations around the world.
IBM DOORS
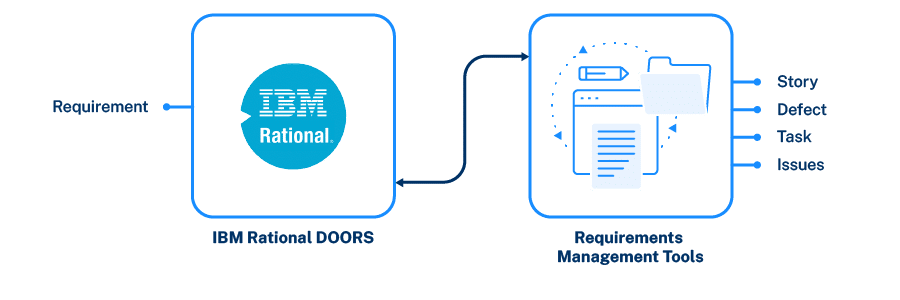
IBM Rational DOORS (Dynamic Object-Oriented Requirements System) is a requirements management tool. According to Wikipedia, DOORS is designed to ‘ease’ the requirements management process with a variety of features, including:
- Using your web browser, a business analyst can access the system of record for requirements using Rational DOORS Web Access
- Business and Requirements Analysts can manage and track changes to requirements, effectively governing the change control process within the tool
- Organizations can involve their suppliers and development partners in the creation of requirements through the ‘Requirements Interchange Format’
- You can link requirements to design items, test plans, test cases, and other requirements for easy and powerful traceability
- Requirements discussions within DOORS help extend the collaboration effort to marketing, suppliers, system engineers, and business users
- Testers can link requirements to test cases using the ‘Test Tracking Toolkit’ for manual test environments
Out of the box, DOORS also integrates with the other Rational tools, e.g.: Rational Team Concert, Rational Quality Manager, DOORS Next Generation, and others. However, the tool does not integrate with leading-edge Agile Planning tools like JIRA or Azure DevOps without some help from platforms like ConnectALL. To enable end-to-end comprehensive traceability, organizations often need to bridge the gap between more ‘legacy’ products like IBM DOORS with widely adopted Agile Planning products like JIRA. ConnectALL’s Value Stream Integration platform can integrate DOORS with a multitude of newer age products like Jama Software, Jira, and Azure DevOps.
JAMA Software
Jama Software is another product that offers the breadth of software development feature functionality, including: requirements management, traceability, test management, and bug tracking. Their flagship product, Jama Connect™, was recently awarded as a top ranked Application Lifecycle Management (ALM) Tool by consumer reviews site, TrustRadius. Jama Connect, similar to IBM DOORS, offers highly regulated industries like Medical Device Development with a customized version of their product to manage workflows, audit, and compliance requirements.
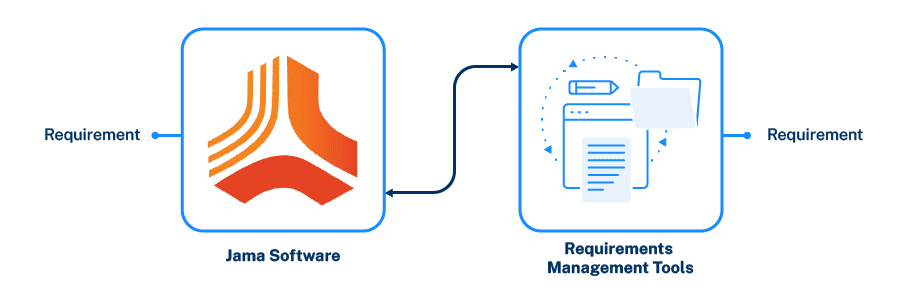
Similar to other vendors, Jama’s product is extensible with a set of OOTB (out-of-the-box) integrations to third party products like Jira and Tricentis. The OOTB integrations are designed to help integrate requirements and test cases with full traceability and visibility. The objective of offering this type of integration is to minimize delays in product development due to misalignment by offering real-time visibility into test coverage and development status.
By using ConnectALL’s Value Stream Integration platform, organizations can aggregate and monitor metrics across software development tools. Since most organizations adopt a multi-tool strategy beyond simple point-to-point integrations (e.g., Jama > Jira), calculating lean metrics like lead time, cycle time, and velocity/throughput can be challenging. ConnectALL Analytics takes the pain out of multi-tool analytics reporting and metrics.
Atlassian JIRA
Atlassian JIRA, founded in 2002, is a mainstay on development teams across the world. If you work in IT and have not heard of JIRA, you might be living under a rock. It is undoubtedly the #1 software development tool used by Agile teams the world over, according to usage statistics. Originally, JIRA was known as a ‘bug tracking’ or ‘issue tracking’ tool. Over the years, it has evolved into an Agile Planning platform that includes multitudes of capabilities far beyond its original intent of tracking bugs.
According to JIRA, the product is used by over 75,000 customers in 122 countries. The platform itself consists of four (4) different packages:
- JIRA Core – Generic Agile project management
- Jira Software – Adds specialized Agile project management features
- Jira Service Desk – Adds feature functionality for help and service desks
- Jira Ops – Adds feature functionality for incident management
ConnectALL, formerly part of Go2Group, the leading Atlassian Reseller for over 20 years, can be used to integrate JIRA with a multitude of different tools.
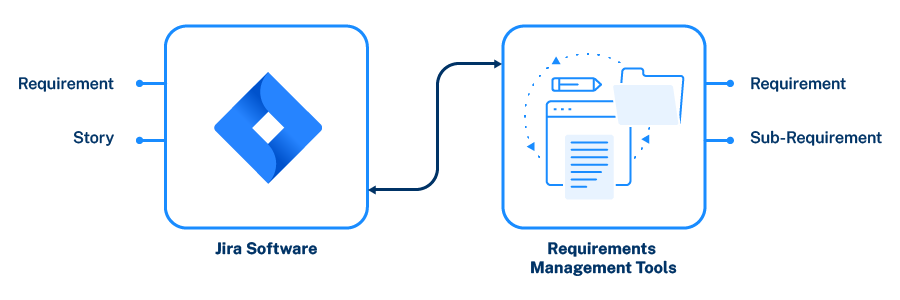
Although JIRA’s core marketing message does not mention ‘requirements management,’ make no mistake, the tool itself can be used to manage the requirements intake process. IBM DOORS was historically adopted by organizations seeking deep auditability and compliance, such as defense or pharmaceutical companies. The problem is that many organizations enjoy the flexibility and lightness of tools like JIRA over IBM DOORS for other business units. Instead of choosing one over the other, companies are leveraging ConnectALL to integrate the two (2) products.
As requirements are added to DOORS, they automatically synchronize over to Atlassian JIRA based on a specific status change. According to Lean metrics in software development, lead time calculation is measured from the point a customer requests ‘something’ (a change, a new feature, an enhancement) to when it’s delivered (pushed to production). The problem is that most organizations tend to focus on ‘commit-to-deploy’ and have locally optimized this ‘leg’ of the software delivery journey. DevOps pipelines with integrations between source code management repositories, CI/CD tools, and release platforms have been perfected within many companies. What is not fully understood is how long the journey is from an idea/request from a customer, to the scoping of a requirement, to the breakdown of that requirement, to the test planning, to the test execution, defect resolution (if any are found), and the release of that code change to the customer.
If you are like most companies, perhaps you’re only using IBM DOORS for requirements management, but aren’t taking advantage of its other useful features like test planning, test design, test execution, or defect management. And maybe you are using other tools and/or processes, like Microsoft SharePoint and Excel spreadsheets, for tracking customer ideas and requests. Measuring when an idea is received, to when its actually reviewed as viable, to whether its scoped for build or not becomes exceedingly difficult if multiple tools and methods are being used across your value stream. This is not to suggest that you consolidate within one tool, but rather is a call-for-action to consider the “black hole” of time elapsed between each stage of a requirement, or even the possibility that the customer’s voice is not even heard by key decision makers at your company. And to also consider the lack of traceability from the requirement itself to other tools in your value stream like Micro Focus Quality Center that house your test plans and test execution results.
“Measuring lead time can be tricky in a multi-tool environment, because of varying workflows and statuses. What is unique about ConnectALL Value Stream Insights is its ability to give you visibility across the chain with aggregation of data from many tools. We can illuminate the inefficiencies you can’t see upstream. – CJ Henry, Lead Analytics Architect and Former Fortune 500 Director
Microsoft Azure DevOps
Azure DevOps (ADO) provides version control, reporting, requirements management, project management, automated builds, testing and release management capabilities. Effectively, it is marketed as an all-in-one platform for IT software development teams. According to Wikipedia, “it covers the entire application lifecycle, and enables DevOps capabilities.”
If you remember Visual Studio Team Services (VSTS), then you will recognize ADO. It’s the evolution of VSTS that now includes boards, repos, pipelines, test plans, and artifacts. The ‘pipeline’ feature of ADO really focuses on the CI/CD portion of your software value stream. You can connect ADO to GitHub and deploy continuously to any cloud environment (think AWS, Azure, Rackspace, etc.). You can also build and push images to container registries like Docker Hub, Azure Container Registry, or deploy containers directly to individual hosts or Kubernetes.

Much like other tools in the marketplace, not all its features are fully utilized by organizations due to a variety of reasons. Perhaps a particular business unit at your company has an affinity towards Tricentis TOSCA or Micro Focus Quality Center for testing, instead of using ADO’s testing feature functionality. Measuring the end-to-end lead time will require you to calculate the hand-offs between tools, people, and processes. Manually measuring it with ‘guestimates’ is an inexact science, but systematically tying your tools together with ConnectALL and enabling Insights to automatically measure lead time can show you the entire end-to-end journey. For example, you can peer down into the knitty gritty of each workflow. Take, for example, your testing and defect management process.
Most organizations break testing down in various workflows:
- Test planning: consists of analyzing unambiguous requirements, creating a high-level test scenario, and then breaking down the high-level test scenario into discrete test plans (aka, cases). Each test case has various status levels, just like every requirement has various status levels. The ‘aging’ between each status level within each work item is of critical importance to understanding where your bottlenecks exist. For example, what if your test cases are “Ready for Review” for over a week? Could that indicate a potential capacity issue on your team, or worse yet – the folks who are assigned to review test cases (like SMEs in that domain area) were never notified of their responsibility to review and sign off on the test cases. This type of “waste” happens all of the time in real world practice. To identify this type of waste, you need intelligence (both human and machine) that monitors the evolution of each work item throughout your value stream.
- Test execution: this particular phase of testing can be either manual or automated. For manual testing cycles, there is a workflow: No Run, Not Completed, Failed, Passed, or N/A. Although your QA Leaders are doing their absolute darndest to give you the most up-to-date metrics, they are only giving you a glimpse into their purview, or their domain. They can probably tell you the ‘aging’ of test cases, what blockers might exist, and why it’s taking so long for re-testing to occur on failed test case(s), but what they can’t tell you is how this stacks up to other processes in your value stream. For example, perhaps the test case(s) are taking longer to manually execute because the steps are not clear, or the necessary data is not defined properly. Could this be the result of an ambiguous requirement, which led to ineffective test scenarios, which ultimately led to sub-standard test cases? Absolutely. It is critical to understand elapsed time in context of other phases and activities in your software value stream. Analyzing metrics in a vacuum gets you nowhere, but viewing them in relation to what is supposed to occur in your process further upstream is critical to identifying inefficiencies.
- Defect Resolution: identifying and fixing defects is a critical component of your value stream. Protecting your brand reputation with high-quality software is at the forefront of every CIO’s agenda these days. Within minutes, a new user makes a “Yay or Nay” decision about your software and reviews/grades it accordingly. Native mobile applications are notoriously scrutinized and slow load times or crashing screens will undoubtedly tank your business. If your organization is designing and building software where human life on the line, bulletproofing your quality assurance and testing processes is critical. But sometimes the problem is not whether you find the defects, it’s how quickly you can fix and retest them before the scheduled go-live date of your next scheduled launch date. The in-between “stuff” of when a defect is identified, to when it’s assigned, to when it’s fixed, to when it’s ready for re-test, and to when it’s closed is part of your overall lead time. Often, the long pole in your tent will be how quickly your defects are identified, assigned, fixed, re-tested, and deployed. Before you can ship the latest build to your customers, your defects should be remediated. With value stream management and ConnectALL Insights, you will have visibility into the ‘aging’ (elapsed time) between the various stages of your defect workflow as well. By measuring, analyzing, and monitoring this particular workflow, you can illuminate inefficiencies between your QA and Application Development teams. For example, the “ping pong” phenomena between QA and Application Development can significantly increase overall lead time. If the testing evidence (e.g., screen shots, data inputs) is not adequate for your Application Development team, they will often bat the defect back over to your QA team. This phenomenon, along with multiple re-tests, can continue over and over – slowing down your entire release build.
“A multitude of workflows exist within the QA & Testing process. Ambiguous requirements often lead to faulty test plans, which inevitably lead to poor test coverage. By monitoring the ‘mini workflows’ and time elapsed between legs of your testing journey, you can pinpoint problems.
– Matt Angerer, Author of 7 Reasons Why Value Stream Integration Improves Software Quality Assurance
Does this adequately describe the “knitty gritty” of the many workflows in your software value stream? There are so many various types of ‘work items’ that make up your software value stream, starting at the request and/or idea level from a customer. Understanding the end-to-end can only occur if you start at the macro-level, then closely analyze the micro-level across the various ‘legs’ in your journey. And since many organizations have a multi-tool approach to software development, you must consider the “whole” when analyzing your metrics – otherwise, you are playing a guessing game.
ServiceNow
According to ServiceNow, they help organizations “Digitize their Workflows” – but are mostly known as an Incident and Problem Management solution to the general public. Others refer to ServiceNow as a “ticketing tool” that processes and catalogs customer service requests. Taking it a step further, the tool can help customers raise incidents, changes, problems, and other services. The tool itself has its roots in ITSM (Information Technology Service Management) since 2012.

As the tool evolved, like Azure DevOps and Atlassian JIRA, additional feature functionality was added to encapsulate the breadth of software delivery – from requirements inception to Agile planning. According to InfoClutch.com, ServiceNow dominates the ITSM market with over 35% market share and 14,000 customers. The platform’s ability to help organizations create workflows that can automate hand-offs between different personas in the software delivery value stream make it extremely powerful.
ServiceNow Integration Hub is also a powerful feature of this platform, allowing organizations to build integrations with other best-of-breed tools in the marketplace today. Similar to ConnectALL’s Value Stream Integration platform, ServiceNow’s Integration Hub helps companies tie their tool chain together, although the breadth of pre-built adapters does not match ConnectALL’s depth of capability.
Measuring how quickly you solve customers’ incidents and problems is a key performance indicator (KPI) for many organizations. The velocity at which you’re able to respond to an inquiry, analyze it, determine the root cause, and deliver a fix says a lot about your internal processes and ability to maintain a high level of customer satisfaction. If you are using other tools to validate the ‘fix’ like Azure DevOps or JIRA, make sure you are counting the elapsed time from the point of incident receipt.
Tricentis TOSCA
Tricentis Tosca is a software testing tool that is used to automate end-to-end testing for software applications. According to their website, it is a continuous testing platform that accelerates testing to keep pace with Agile and DevOps. The breadth of testing capabilities baked into this platform cover the gamut, including:
- Risk-based testing
- Test management
- Manual testing
- Exploratory testing
- Service virtualization
- Impact analysis
- Load testing
- Test data management
- API testing
- BI & Big Data
- Continuous integration
- Analytics
The platform can also be used to manage requirements that are used with their risk-based testing capabilities, but many organizations continue to use other tools like Quality Center or DOORS for requirements management. Organizations leveraging ConnectALL’s Value Stream Integration Platform can connect Tricentis TOSCA with all of the major requirements planning tools.
TOSCA’s flagship feature capability is around their approach to model-based test automation. Their proliferation through the global marketplace has been rampant, far exceeding other testing solutions.

“From my perspective, Tricentis TOSCA has overtaken the mainstay testing tools like UFT and SAP TAO across SAP-run organizations. They have aggressively entered and captured the marketplace. Recently, they signed a partnership deal with SAP that will strengthen their integration capabilities with ALM Cloud and SAP Solution Manager.”
Matt Angerer, Author of Building an SAP Testing Center of Excellence
Micro Focus Quality Center
Micro Focus Quality Center, formerly known as HPE Quality Center, is a quality management software offered by Micro Focus, who acquired the software division of Hewlett Packard Enterprise in 2017. According to Micro Focus, ALM/Quality Center is a comprehensive, unified, flexible, and extensible application lifecycle management product. Like many other products on the market, it is designed to provide a singular, all-inclusive platform that facilitates end-to-end traceability.

The reality, however, is that many organizations have adopted a multi-tool strategy across their business units. Although Quality Center can handle the workflows across all of the work items that encompass a full software value stream, many companies only use bits and pieces of its overall functionality. With its long-standing history in the marketplace, companies invested heavily into the “core” of their IT practices by using ALM/Quality Center to control extensive workflows. As organizations created DevOps-ready business units, they faced a dilemma with the traditionally designed/architected Quality Center product and needed something that lent itself to Agile at Scale. Micro Focus answered this customer demand with its next generation platform called ALM Octane.
Recognizing the necessity of integrating both tools, Micro Focus ALM Octane includes a built-in “Connector” to establish synchronization with ALM/Quality Center. The problem, however, is that many organizations have a multi-tool and multi-vendor approach to DevOps and Testing tools. Being a vendor and tool-agnostic platform, ConnectALL can establish value streams across a myriad of different products and tools (not just Micro Focus products).
Overview of Popular BI Tools
Business Intelligence software, as the name implies, is software designed to retrieve, analyze, transform, and report data. Generally, BI software reads data that has been previously stored in a data warehouse or data mart. ConnectALL’s Database Adapter enables organizations to flow data from popular software development tools directly into a centralized data store, while synchronizing the data across toolsets. The advantage of our Database Adapter is that you can use BI tools like Tableau, Microsoft Power BI, Grafana, and Metabase to create Lean Metrics for monitoring the efficiency of your software value stream. In this guide, we will provide you with a quick overview of each popular BI tool, along with specific information below on how to calculate each lean metric (with the actual SQL code). We will also explore the popular term known as “flow” in the world of software delivery, metrics, and reporting.
Tableau
Tableau Software is a data visualization company focused entirely on business intelligence. With both SaaS and Hosted options, Tableau provides a quick & easy way to get up and running with ConnectALL Insights. Tableau Online is offered for free.
Microsoft Power BI
Power BI is a business analytics service by Microsoft. It aims to provide interactive visualizations and business intelligence capabilities with an interface simple enough for end users to create their own reports and dashboards. By connecting Power BI to a database receiving data via ConnectALL’s database adapter, you can begin creating lean metrics to monitor the flow through your value stream.
Grafana
Grafana is a multi-platform open source analytics and interactive visualization web application. It provides charts, graphs, and alerts for the web when connected to supported data sources. Like other products, this tool is expandable through a plug-in system. According to Wikipedia, end users can create complex monitoring dashboards using interactive query builders.
Metabase
Metabase is another open source analytics and interactive visualization web application.
What is Flow?
Let’s not overcomplicate “flow” as it relates to software delivery. Simply put, flow time allows you to view the “flow of work” through its various stages. Our “flow time” lean metric allows you to count the average time the artifact spends in each state of the workflow daily. Ideally, you want work to move along in a steady, continuous stream through your value stream. Wait time is muda (waste).
Your ability to visualize flow through a software value stream is critical to achieving a roadmap of software delivery predictability. Knowing your team’s capacity across tools allows you to identify problems and speed up flow when necessary. On a production floor, it’s much easier to visually see where flow problems and bottlenecks occur. The plant manager can walk around and view the product moving from one station to the next, or from one department to the next, then out the door for shipment to the customer. In software delivery, it is a bit more complicated – but achievable. Kanban boards are often the defacto standard for Agile teams to monitor their flow of work, but what happens when you have multiple tools tied together across many business units?
Flow is often interrupted when work items are transformed through various systems. For example, what if the requirement that was originally written in IBM DOORS and was synchronized to Jama Connect was ambiguous? Let’s say an organization has multiple decentralized teams of business analysts that work in both DOORS and Jama Connect. If the requirement that was written by BA Team #1 (logged in DOORS) is synchronized/replicated into Jama Connect and after review by BA Team #2 is deemed as ambiguous – flow is interrupted. The requirement needs to be clarified, expanded, and made understandable before BA Team #2 (working from Jama) can start breaking it down into Features, User Stories, and Tasks.
In this case, BA Team #2 might take the bull by its horns and start updating the requirement itself (directly in Jama Connect) and allow value stream integration technology like ConnectALL to do its work by synchronizing data points back over to IBM DOORS. Or, BA Team #2 may very well push back on BA Team #1 by changing the status to “rejected” and adding a comment to the requirement requesting that further clarifications are provided. Either way, the goal of achieving a steady and continuous stream of value was interrupted by an ambiguous requirement. This is analogous to a bolt missing on a product going down a conveyor belt at the factory. The primary difference is that it takes discernment, judgement, and experienced intelligence to identify a problem in a software value stream – whereas almost anyone can look at a widget on a convey belt and determine that a bolt is missing.
Overview of Lean Metrics
With ConnectALL Value Stream Insights, organizations can quickly create lean metric reports from a variety of tools like Micro Focus ALM, Jama Connect, and Atlassian JIRA. In this guide, we reviewed the most popular and widely used ALM, Agile Planning, and Testing tools. The market, however, is continually adapting and adjusting with new DevOps tools. With ConnectALL’s patent-pending Universal Adapter, companies can adapt quickly by integrating to third-party tools with a REST API.
As a free give-away, ConnectALL has outlined the most common lean metrics herein with a description of what each means and what fields/attributes are required. We have even provided you with pre-written SQL statements that you can copy/paste into your BI tool-of-choice. Each SQL statement should be closely reviewed and modified to your specific tools, workflows, and processes – but the “heavy lifting” has already been done for you. If you have any questions about these metrics or SQL statements, we encourage you to reach out to ConnectALL to setup a free Insights Deep Dive session.
- Cycle Time – The time it takes from the start of work to it being completed. Averaging the time it takes for an artifact from the first time it’s touched until it is closed.
- Lead Time – The time from the item being created, until the work is in production. Calculating the time from artifact to creation until it is completed.
- Blocker Trend – How many items are blocked currently. Also compared to last week’s count. Counting the number of artifacts sitting in a “blocked” state at any given time, then comparing to last week’s count.
- Blocker Time – Average time items stay blocked. Counting the average amount of time artifacts sit in the value stream.
- Queue Time – The amount of time work sits waiting for actions to be performed, averaging the amount of time an artifact sits in a “waiting” state.
- Throughput – The amount of work a team can complete in a defined time period (aka, velocity). Taking a count of artifacts closed daily.
- Production Impact – The number of defects created in production after a release goes live. This is a combination of 2 queries. First, a query to find the release date of a version based on the max Resolved Date of issues tagged with that release. Second, a query to show a count of issues reported from production by Created Date.
- Work in Process (WIP) – All unfinished work that is in various stages of the process. Counting all artifacts in the Support area that have started work but are not completed yet.
- Flow Time – Viewing the flow of work through its various stages. Counting the average time artifacts spend in each state of the workflow daily.
- Value Added Time – This is the processing time associated with production. Counting the average time artifacts spend in an actual work state.
- Mean Time to Repair (MTTR) – It represents the average time required to repair a failed component or defect.
- Escaped Defect Ratio – The ratio of defects filled by customer or end user, for a particular release to the total number of defects for that release.
Cycle Time
The time it takes from the start of work to it being completed. Averaging the time it takes for an artifact from the first time it’s touched until it is closed.
Required Fields:
- Modified On
- Created On
- State
- System ID
SQL Statement:
select TIME_TO_SEC(TIMEDIFF(S.`modified_on`, R.modified_on))/3600/24 diff, t.created_on from
(select system_id,max(modified_on) modified_on from txn_log t1 where state = ‘closed status’ group by system_id) S,
(select system_id,min(modified_on) modified_on from txn_log t2 where state = ‘1st status work begins in‘ group by system_id) R,
txn_log t
where S.system_id = t.system_id
and R.system_id = t.system_id
group by t.system_id,S.modified_on,R.modified_on
Lead Time
The time from the item being created, until the work is in production. Calculating the time from artifact to creation until it is completed.
Required Fields:
- Resolved Date
- Created On
- System ID
SQL Statement:
select To_days(resolved_date)-To_days(created_on), created_on from work_management
where resolved_date is not null and created_on >”date“
group by system_id
Blocker Trend
How many items are blocked currently. Also compared to last week’s count. Counting the number of artifacts sitting in a “blocked” state at any given time, then comparing to last week’s count.
Required FIelds:
- Created On
- State
- System ID
SQL Statement:
SELECT str_to_date(concat(yearweek(`txn_log`.`created_on`), ‘ Sunday’), ‘%X%V %W’) AS `created_on`, count(distinct `txn_log`.`system_id`) AS `count`
FROM `txn_log`
WHERE (`txn_log`.`state` = ‘status considered blocked‘
OR `txn_log`.`state` = ‘additional blocked status‘)
GROUP BY str_to_date(concat(yearweek(`txn_log`.`created_on`), ‘ Sunday’), ‘%X%V %W’)
ORDER BY str_to_date(concat(yearweek(`txn_log`.`created_on`), ‘ Sunday’), ‘%X%V %W’) ASC
Blocker Time
Average time items stay blocked. Counting the average amount of time artifacts sit blocked in the value stream.
Required Fields:
- Created On
- State
- System ID
SQL Statement:
SELECT avg(state_elapsed_time.delta_time)/1000/3600/24, work_management.created_on
from state_elapsed_time
Inner join work_management
ON state_elapsed_time.system_id=work_management.system_i
WHERE (state_elapsed_time.old_state = ‘blocked status‘ and `state_elapsed_time`.`new_state` = ‘status after blocked‘)
AND date(`work_management`.`created_on`) BETWEEN date(date_add(now(), INTERVAL -60 day)) AND date(now())
group by old_state, work_management.created_on
Queue Time
The amount of time work sits waiting for actions to be performed. averaging the amount of time an artifact sits in a “waiting” state.
Required Fields:
- State
- Created On
- System ID
SQL Statements:
SELECT avg(state_elapsed_time.delta_time)/1000/3600/24, old_state, work_management.created_on
from state_elapsed_time
Inner join work_management
ON state_elapsed_time.system_id=work_management.system_id
WHERE (`state_elapsed_time`.`old_state` = ‘workflow status where work waits‘)
AND date(`work_management`.`created_on`) BETWEEN date(date_add(now(), INTERVAL -60 day)) AND date(now())
group by old_state, work_management.created_on
Throughput
The amount of work a team can complete in a defined time period. (aka – Velocity). Taking a count of artifacts closed on a daily basis.
Required FIelds:
- Created On
- Artifact Type
SQL Statements:
SELECT date(`work_management`.`created_on`) AS `created_on`, count(*) AS `count`
FROM `work_management`
WHERE (date(`work_management`.`created_on`) BETWEEN date(date_add(now(), INTERVAL -60 day))
AND date(now()) AND `work_management`.`artifact_type` = ‘artifact type‘)
GROUP BY date(`work_management`.`created_on`)
ORDER BY date(`work_management`.`created_on`) ASC
Production Impact
The number of defects created in production after a release goes live. This is a combination of 2 queries. First, a query to find the release date of a version based on the max Resolved Date of issues tagged with that release. Second, a query to show a count of issues reported from production by Created Date.
Required FIelds:
- Created On
- Artifact Type
- Resolved Date
- Release Version
SQL Statements:
Count of work:
SELECT str_to_date(concat(date_format(`work_management`.`created_on`, ‘%Y-%m’), ‘-01’), ‘%Y-%m-%d’) AS `created_on`, count(*) AS `count`
FROM `work_management`
WHERE ((`work_management`.`artifact_type` = ‘artifact type‘)
AND date (`work_management`.`created_on`) BETWEEN date(date_add(now(), INTERVAL –timeframe)) AND date(now()))
GROUP BY str_to_date(concat(date_format(`work_management`.`created_on`, ‘%Y-%m’), ‘-01’), ‘%Y-%m-%d’
ORDER BY str_to_date(concat(date_format(`work_management`.`created_on`, ‘%Y-%m’), ‘-01’), ‘%Y-%m-%d’) ASC
Release Dates:
select release_version, max(resolved_date) as ts
from work_management
where resolved_date is not null and release_version is not null
AND date(`work_management`.`resolved_date`) BETWEEN date(date_add(now(), INTERVAL –timeframe)) AND date(now())
group by release_version
Work in Process (WIP)
All unfinished work that is in various stages of the process. Counting all artifacts in the Support area that have started work but are not completed yet.
Required Fields:
- Created On
- Resolved Date
SQL Statements:
SELECT str_to_date(concat(date_format(`work_management`.`created_on`, ‘%Y-%m’), ‘-01’), ‘%Y-%m-%d’) AS `created_on`, count(*) AS `count`
FROM `work_management`
WHERE (resolved_date is null)
AND date(`work_management`.`created_on`) BETWEEN date(date_add(now(), INTERVAL –timeframe)) AND date(now())
GROUP BY str_to_date(concat(date_format(`work_management`.`created_on`, ‘%Y-%m’), ‘-01’), ‘%Y-%m-%d’)
ORDER BY str_to_date(concat(date_format(`work_management`.`created_on`, ‘%Y-%m’), ‘-01’), ‘%Y-%m-%d’) ASC
Flow Time
Viewing the flow of work through its various stages. Counting the average time artifacts spend in each state of the workflow on a daily basis.
Required FIelds:
- Modified On
- Project
- State
SQL Statement:
SELECT date(`txn_log`.`modified_on`) AS `modified_on`, `txn_log`.`state` AS `state`, count(*) AS `count`
FROM `txn_log`
WHERE `txn_log`.`project` = ‘project‘
GROUP BY date(`txn_log`.`modified_on`), `txn_log`.`state`
ORDER BY date(`txn_log`.`modified_on`) ASC, `txn_log`.`state` ASC
Value Added Time
This is the processing time associated with production. Counting the average time artifacts spend in an actual work state.
Required Fields:
- System ID
- Created On
- State
SQL Statement:
SELECT avg(state_elapsed_time.delta_time)/1000/3600/24, work_management.created_on time
from state_elapsed_time
Inner join work_management
ON state_elapsed_time.system_id=work_management.system_id
WHERE (state_elapsed_time.old_state = ‘working state’ and state_elapsed_time.new_state = ‘following state in workflow’)
AND date(`work_management`.`created_on`)
group by old_state, work_management.created_on;
Mean Time to Repair (MTTR)
It represents the average time required to repair a failed component or defect.
Required Fields:
- Created_on
- Artifact_type
- Resolved_date
SQL Statement:
select To_days(resolved_date)-To_days(created_on) Hours, created_on time
from work_management
where resolved_date is not null
and artifact_type = ‘production issue type‘
and created_on >’date range‘
Order by created_on
Escaped Defect Ratio
The ratio of defects filed by customer or end user, for a particular release to the total number of defects for that release.
Required Fields:
- Created_on
- Project
- Artifact_type
SQL Statement:
select count(*) as Issues, project as Project, created_on as timefrom work_management
where artifact_type=’type defined for customer reported issues‘
group by project
Wrapping it Up
Value stream management and lean metrics are not concepts or measurements recently invented. There is nothing unique, proprietary, or original about value stream management. For over 70 years, manufacturing practitioners have used these concepts on their shop floors. As CIOs and DevOps Leaders struggled to find meaning as to why their Agile & DevOps transformational efforts did not deliver upon the business outcomes expected, they started ‘going back to basics’ in their approach to software delivery.
A component of a ‘back to basics’ value stream management strategy in software delivery is seeing the forest through the trees. You don’t need a convoluted framework with a hidden agenda of driving you towards an expensive integration tool. All you need is common sense, experience, and the grit to follow through on the objectives you outline for your software delivery organization.
For instance, what tools are you using across your entire organization? How are new ideas generated? Maybe a product you acquired years ago is still using ZenDesk as their help desk system. You would assume that ZenDesk was used strictly for problem and incident management, but what is occurring with all those “mislabeled tickets” where your customers are suggesting new features? Are those work items ‘archived’ in ZenDesk by your operations personnel, or are they automatically synchronized and routed to Microsoft Azure DevOps’ backlog for review and prioritization? More than likely, you are missing out on the ‘voice of the customer’ and not realizing that these mislabeled tickets are dead in the water within ZenDesk.
By taking a few steps back to understand the forest through the trees, you can begin analyzing, dissecting, and understanding the components of your value stream. ConnectALL’s integration technology can help if you have multiple tools in your value stream and our Insights solution is all you need to monitor flow throughout each value stream. The difficulty in using marketplace integration add-ons for your multi-tooling integration strategy is that you’re not aggregating, normalizing, or saving the evolution of change in each work item. Without understanding how Work Item A evolves through a workflow, it’s difficult to automatically calculate lean metrics to monitor flow.
We hope our Ultimate Guide to Lean Metrics in Value Stream Management (2020 Version) has been helpful. With each passing year, we intend to update our guide with more information. If you have an ALM, Agile Planning, or BI Tool that you would like featured in our popular guide, please email us at in**@co********.com.
*The SQL code provided in our Ultimate Guide is not guaranteed or warranted. Every environment is different. We recommend closely reviewing the syntax with your DBAs and adjusting as necessary.
CJ Henry is a Sr Solutions Architect at ConnectALL. He is a customer-facing technical resource for the ConnectALL integration tool, with a focus on analytics. He works with Account Managers to assess prospect needs and build demo integration solutions, guide prospects through product evaluations, and assist clients with their production deployments.
