ConnectALL Insights Analytics
Become Predictable with Smart Analytics and Metrics
Gain visibility with real-time metrics from your software delivery value stream.
Why Use ConnectALL Insights Analytics?
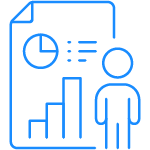
Get a Complete Data Visualization Platform
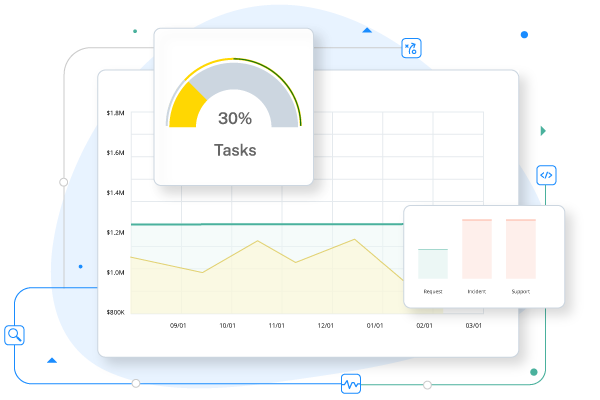
Use the Insights Adapter to pull raw data from every tool in your value stream into our common data model. Then use Insights Analytics to consolidate that data into actionable metrics on a clear, concise dashboard, giving you the "insights" you need to make data-driven decisions.
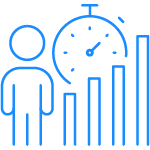
Measure What Matters
ConnectALL's analytics dashboards and data modeling enable you to combine data from any tool in your value stream (including requirements management, development, testing, ITSM, CRM and other development and delivery tools), then use that data to establish where you are today and how you can achieve the next level on your software development journey.
With that in mind, ConnectALL recommends that all metrics be tied to a goal. There should be some rationale and need for collecting measurements, rather than just collecting for the sake of collecting.
The metrics assessment is a complimentary session where a Value Stream Management expert will walk you through the industry proven Goal-Question-Metric (GQM) approach to determine the most critical metrics for your organization.
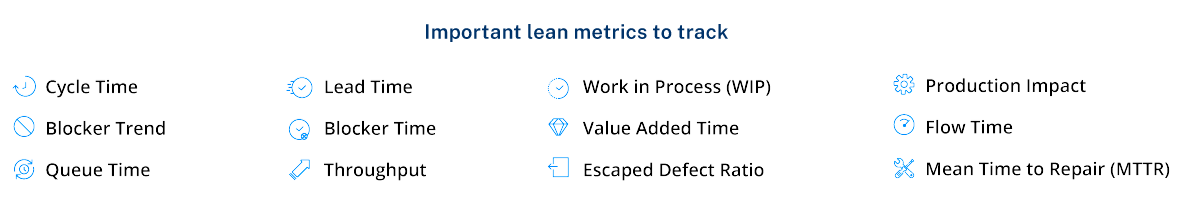
(Ex: Throughput, Lead Time, WIP, Flow Distribution, Flow Efficiency, Flow Utilization)
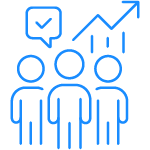
Enterprise Analytics Personalized for Your Key Objectives