“If it ain’t broke don’t fix it”. Sure! That’s a cool quote by Bert Lance. But how do you know if something is broken or not if you can’t see it? Story of everyone’s life in software delivery!
But that changes from here on out! You will now be able to see everything crystal clear in your value stream online. The first complimentary Value Stream diagramming tool from a value stream management company is now publicly available. You can go back to the drawing board and diagram your value streams to get complete visibility.
Before we delve into all the brilliant things you can do with the diagramming application, let’s get some of the basics in place.
What is the Value Stream Designer? The name says it all, but let’s extend it a little bit. It is a diagramming application that enables you to lay out your software development and delivery value stream end-to-end. Capture the flow of materials and information from the ideation stage through production by showing the connection between tools and applications, people involved, and the technology used. Don’t forget to include the customer.
Who can use it? Literally everyone! Teams, managers, partners, C-level executives
What can you do with it? Build comprehensive value stream maps virtually using hundreds of tool connections too
How to get started? Use some of the pre-built templates and thousands of icons, images, applications, symbols and more
Why map your value stream with ConnectALL’s Value Stream Designer?
- Identify waste
- Make processes efficient
- Align cross-functional teams and business goals
- Get a solid point of reference to plan growth
- Focus on doing the right things
What happens after you diagram your value stream?
- You will be able to calculate some important metrics like Takt time as you draw out more information and get granular with product flow.
- You can identify the waste stream and bottlenecks.
- You can identify where to go from there and what, how and when to automate.
Be a part of a value stream management community where you will learn, participate, and apply lean principles and systems thinking knowledge at your organization.
Don’t just believe us. See it for yourself.  If you are crazy about using online applications, you will love the designer.
Here’s what you can expect when you start creating your value streams with the Value Stream Designer.
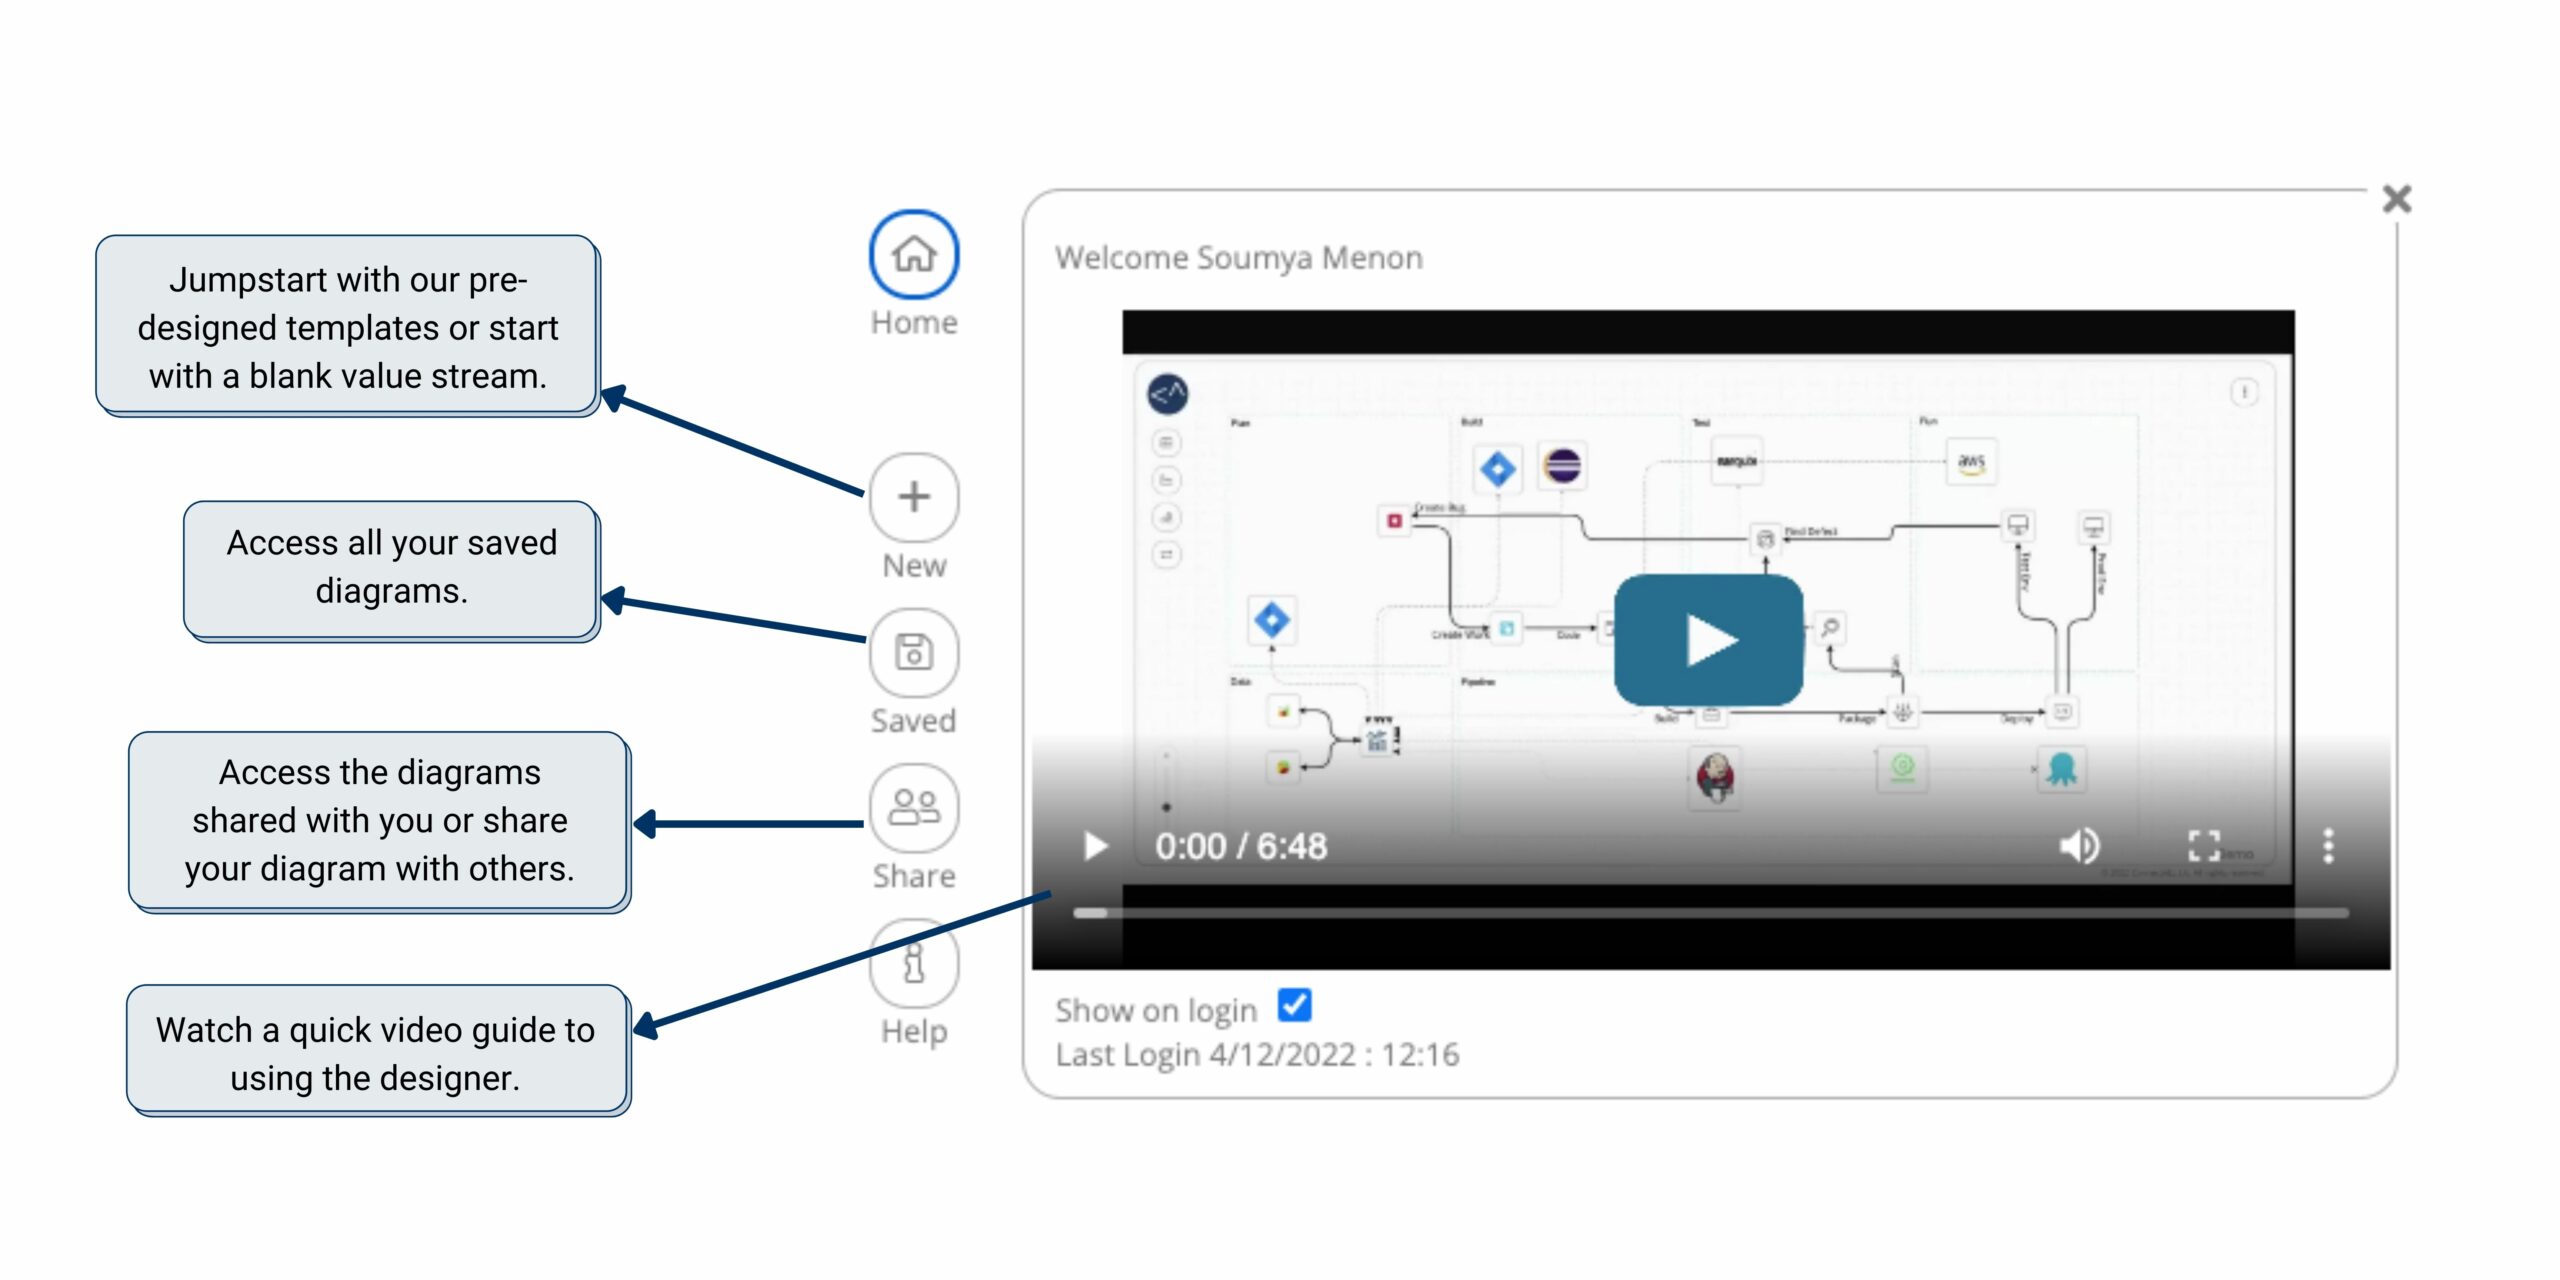
A welcome dashboard to help you get started
When you click new and either select a pre-designed template or a blank, you enter the value stream mapping canvas. You can use the pre-loaded icons of tools and applications, flow shapes, connectors and even upload your own icons to create a picture that demonstrates the relationships between everything flowing through your value stream — including value-added and non-value-added activities. And if you are worried about losing your diagram, don’t fret! Auto-save will save you every time. Just remember to give your diagram an appropriate title/name, whenever you think of one, so that you can access it easily.
Easy drag and drop interface with a contextual toolbar
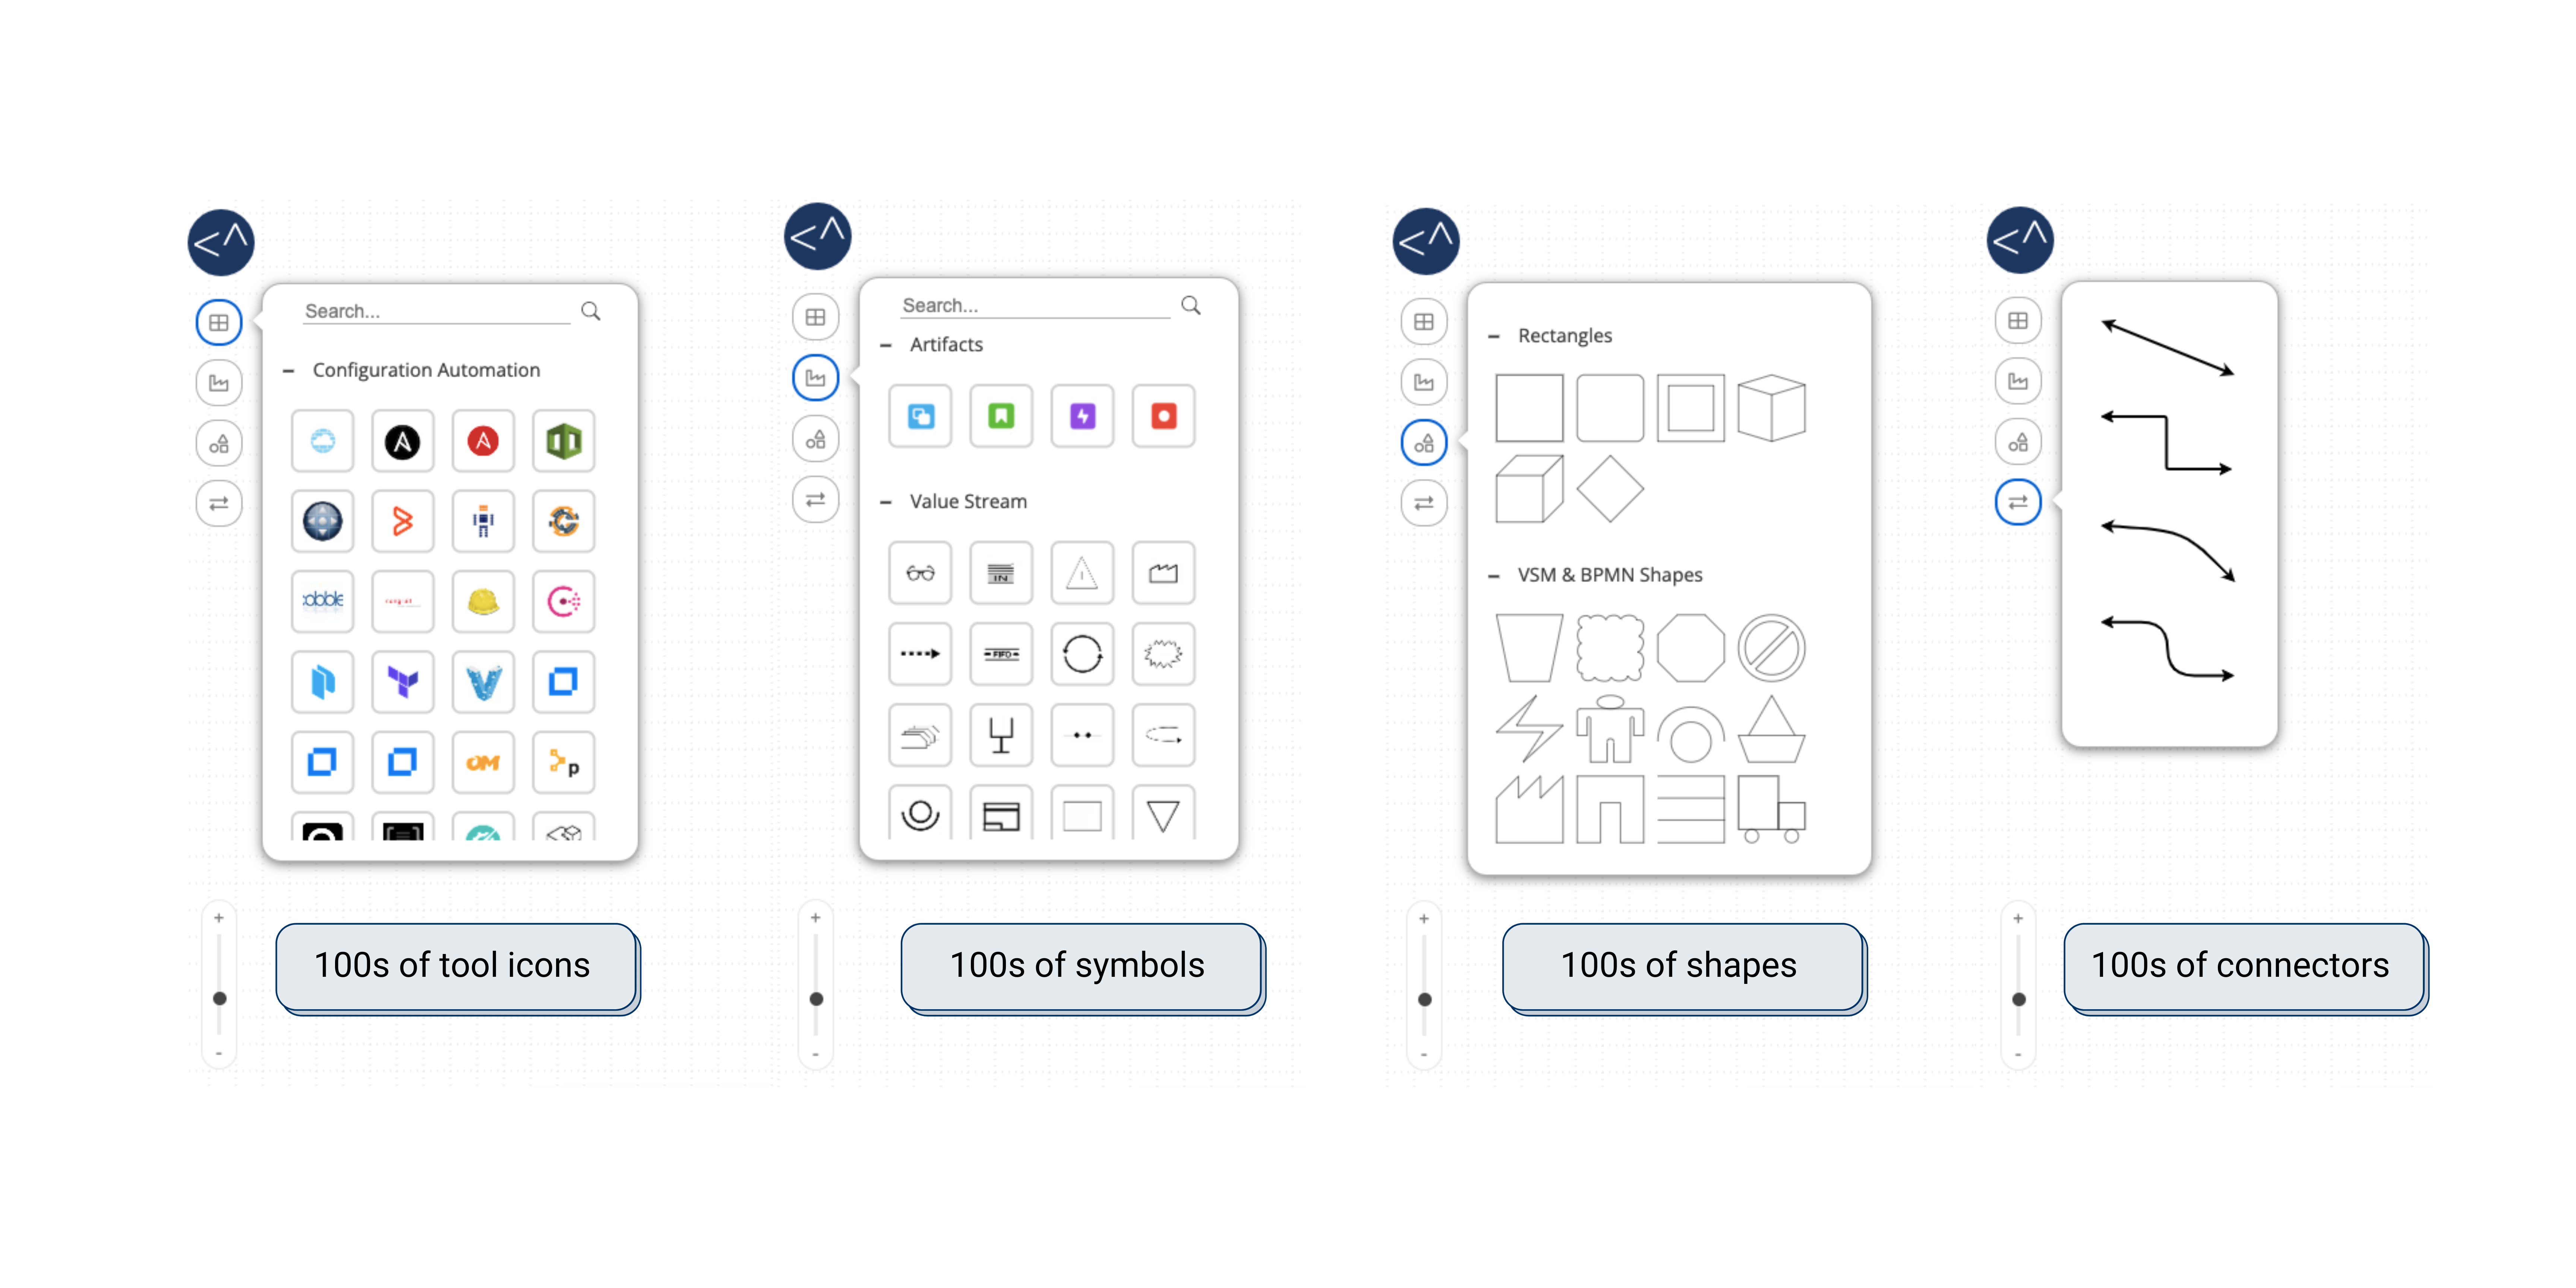
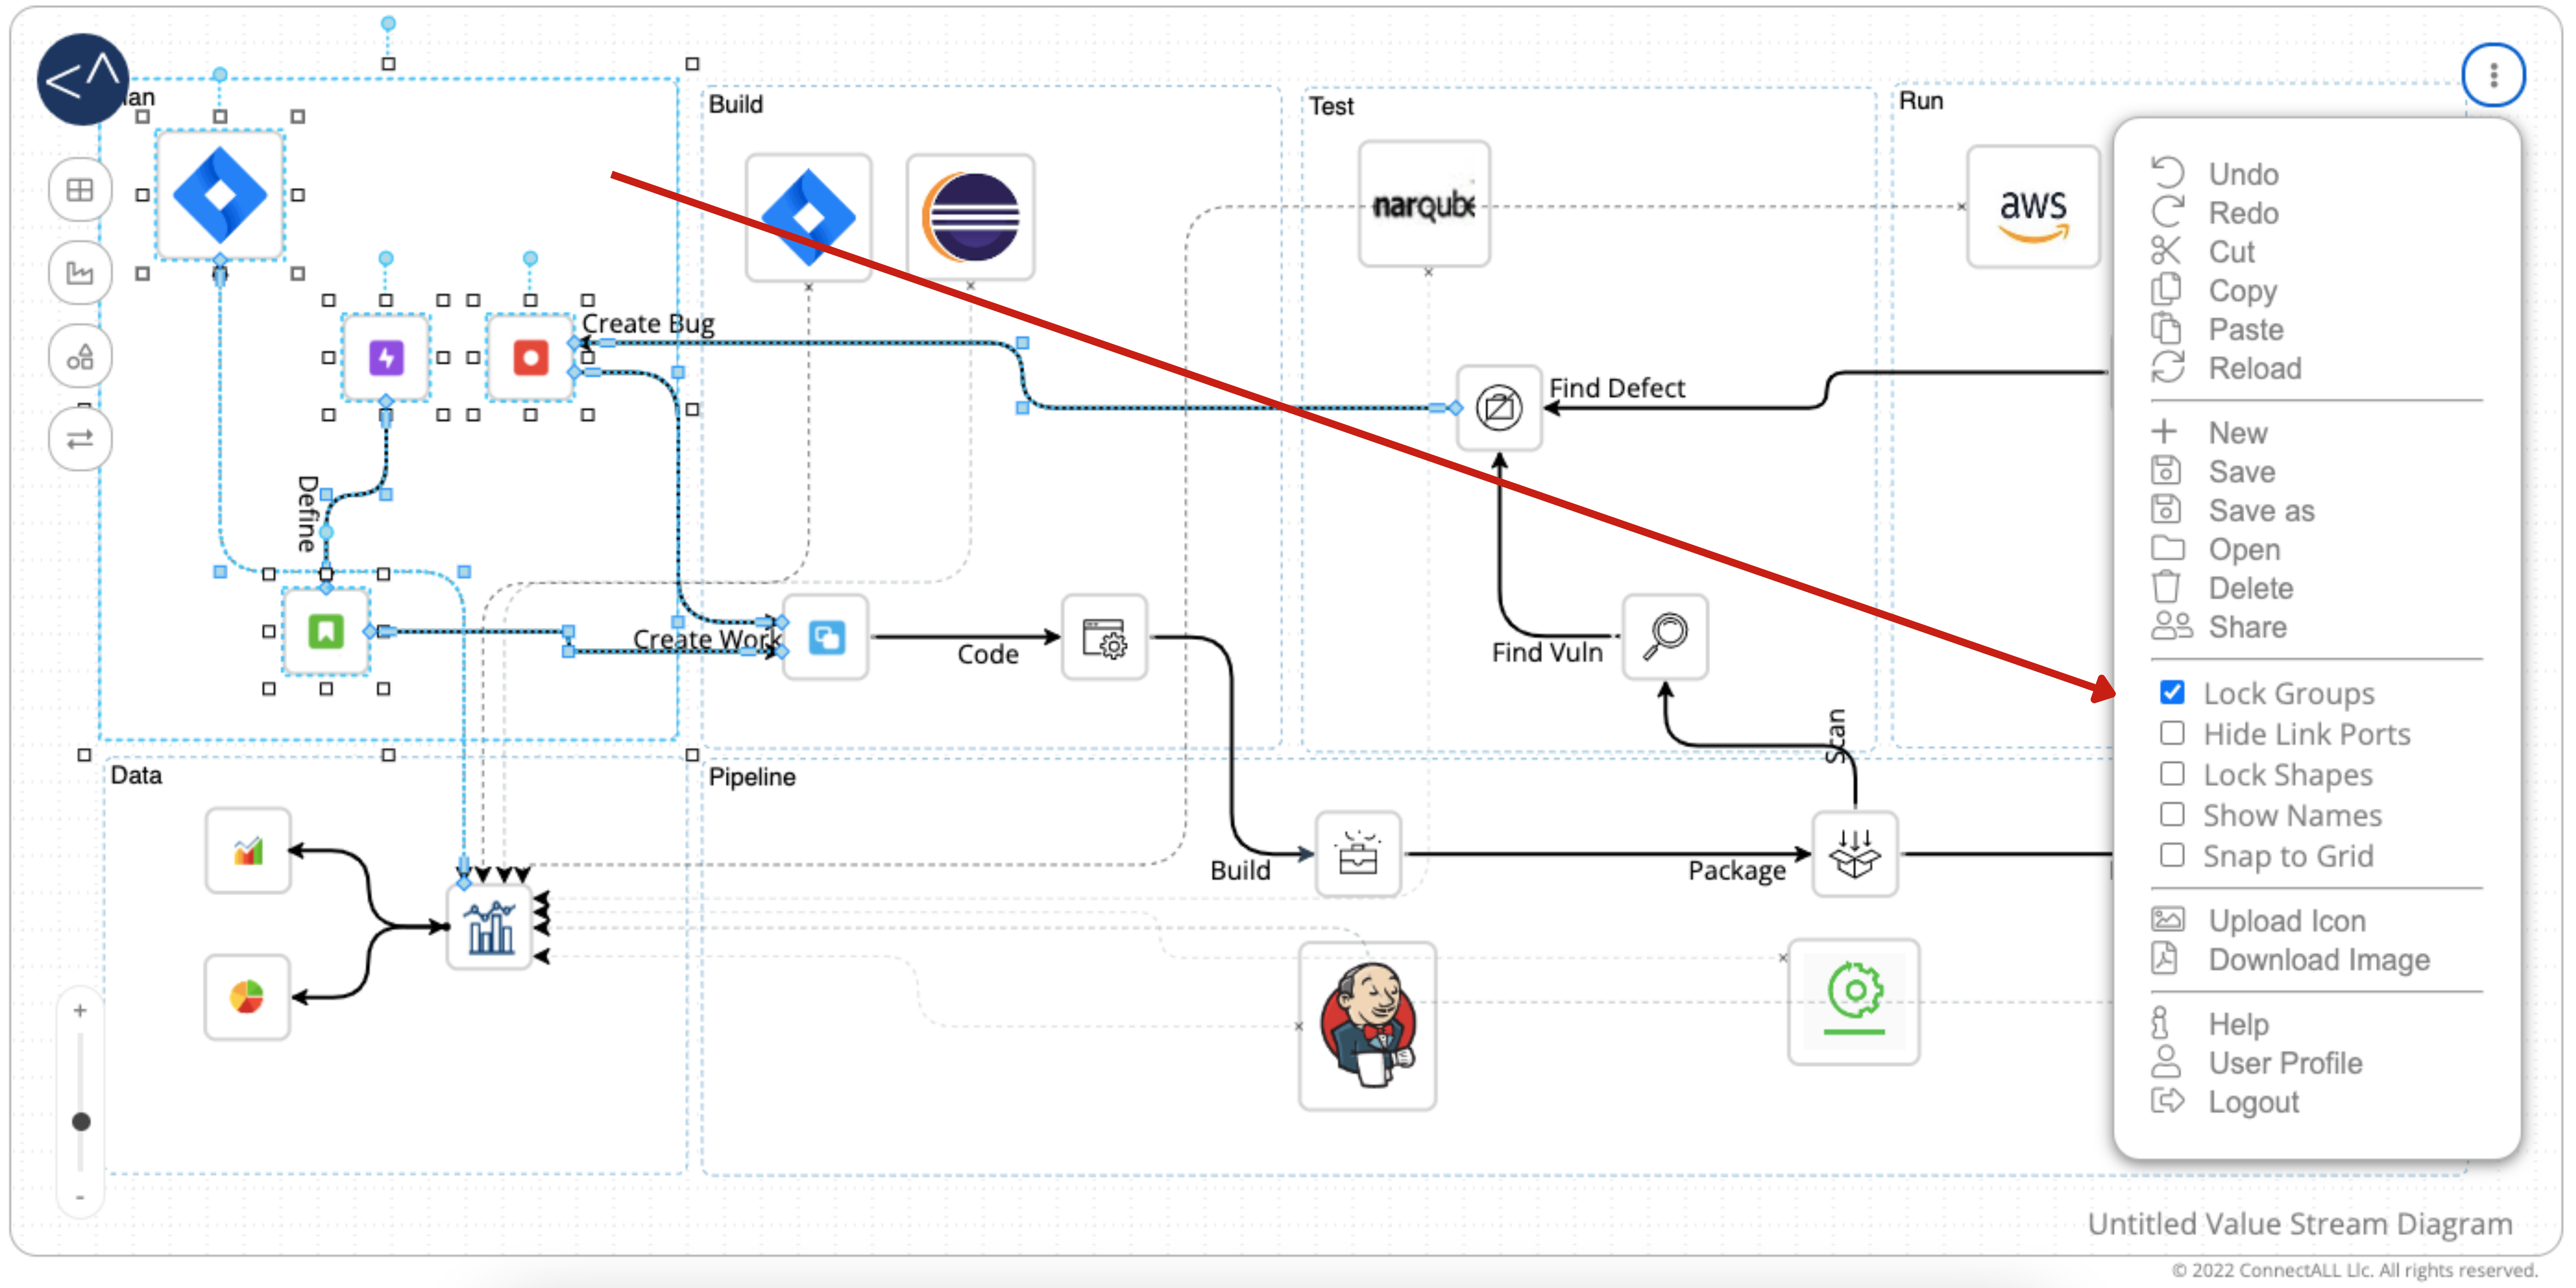
Once you are in your value stream diagramming canvas, all you need to do is to use the intuitive drag and drop interface with a contextual toolbar for effortless designing. Click onto each window and pick the element you want to include in your diagram. Drag and drop it onto the canvas. You can resize it, add names, color the borders, and categorize it too. In a dynamic value stream with lots of icons, images, and shapes, these options are going to make a huge difference. You could also add your own applications, shapes, connectors or icons by simply dragging and dropping it into the canvas or by using the three dots on the right top corner. All your customized uploads will appear as “my icons” or “my applications” in the respective sections of the toolbar.
To start diagramming:
- Choose from 800+ icons of tools and applications that you may already be using in your software development and delivery ecosystem.
- Use flow shapes to annotate your value stream map, denote a Kaizen burst, and represent process phases like ideation, planning, design, code, test, deploy, operate, and more.
- Use flow icons to represent a process step, idea or actor. You can also upload your own icons by dragging onto the screen or by clicking the three vertical dots in the menu displayed on the right side of the canvas. It will be included as “my icon”, which you can rename.
- Use the connectors to connect two application icons. You can name each step or connection to get more granular.
- Use link type icons to also connect the application icons to give your diagram a specified flow, for example you could use angular or curvier links.
[Want to find the exact steps to map your value stream? Check out our easy-to-follow tutorial document]
Pre-designed templates that’ll save you a lot of time and trouble
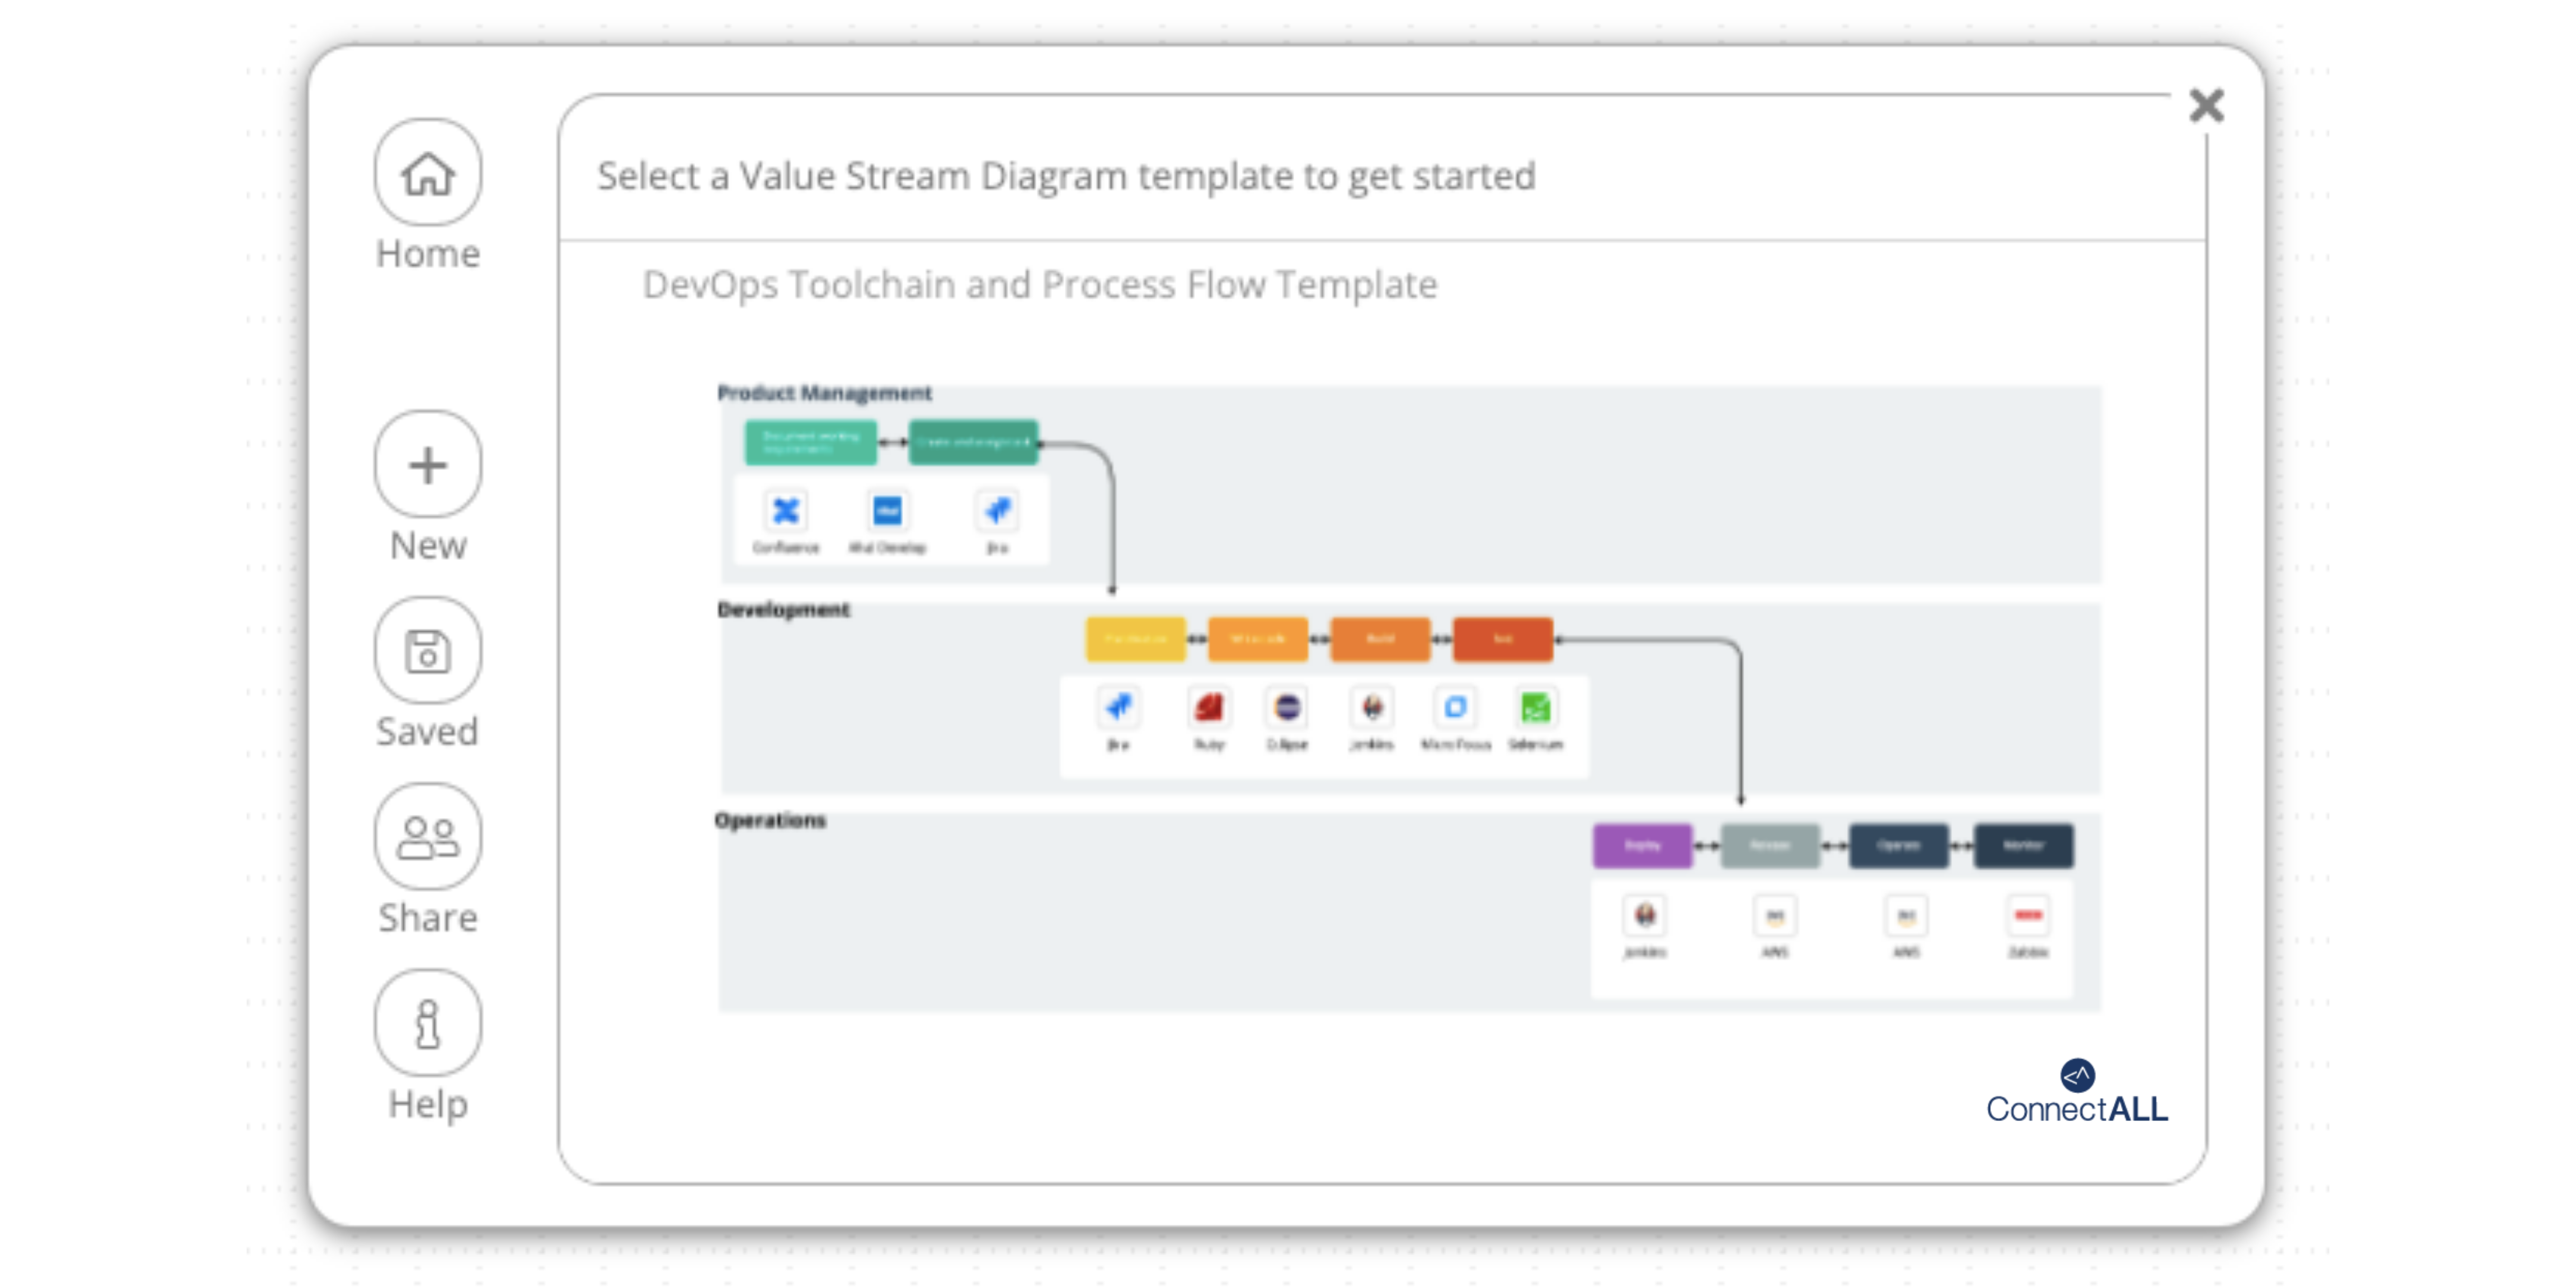
You’ll have a galore of professionally designed, pre-drawn templates to kick-start your projects for all imaginable scenarios — even DevOps workflows, OKRs, governance models, and analytics. You can use them as a foundation and build your diagram. All you need to do is browse through our template list, select a template that will be best suitable for you, and start modifying it. It is easy to modify our built-in templates and draw a diagram. Want to take a break and get back to it? Remember, auto-save will always save you. You can always open, modify, and save as many templates as you want, and then decide which one fits your intent, goal, and plan.
Grouping applications and icons or even value streams to represent phases
Laying out a value stream would require you to show product workflows and this will get granular as you go deeper. Identifying the value-added and non-value-added activities would definitely help in further development of your value stream flow. This would require you to segment applications, icons, objects according to the phases in your software development lifecycle, domains, functions or parallel/sub-value streams. You can easily group these sections by:
- Building the value stream and then grouping: Complete mapping the elements of your value stream and group the segments by drawing boundaries where required and then converting it into a group.
- Creating groups and then building the value stream: You can draw a boundary using a shape, convert it into a group and then build your value stream within it.
[Want a handy guide for reference or to even convince your team or manager to use the designer? Download the Value Stream Designer go-to guide sheet]
Sharing a diagram with anybody for feedback or collaboration
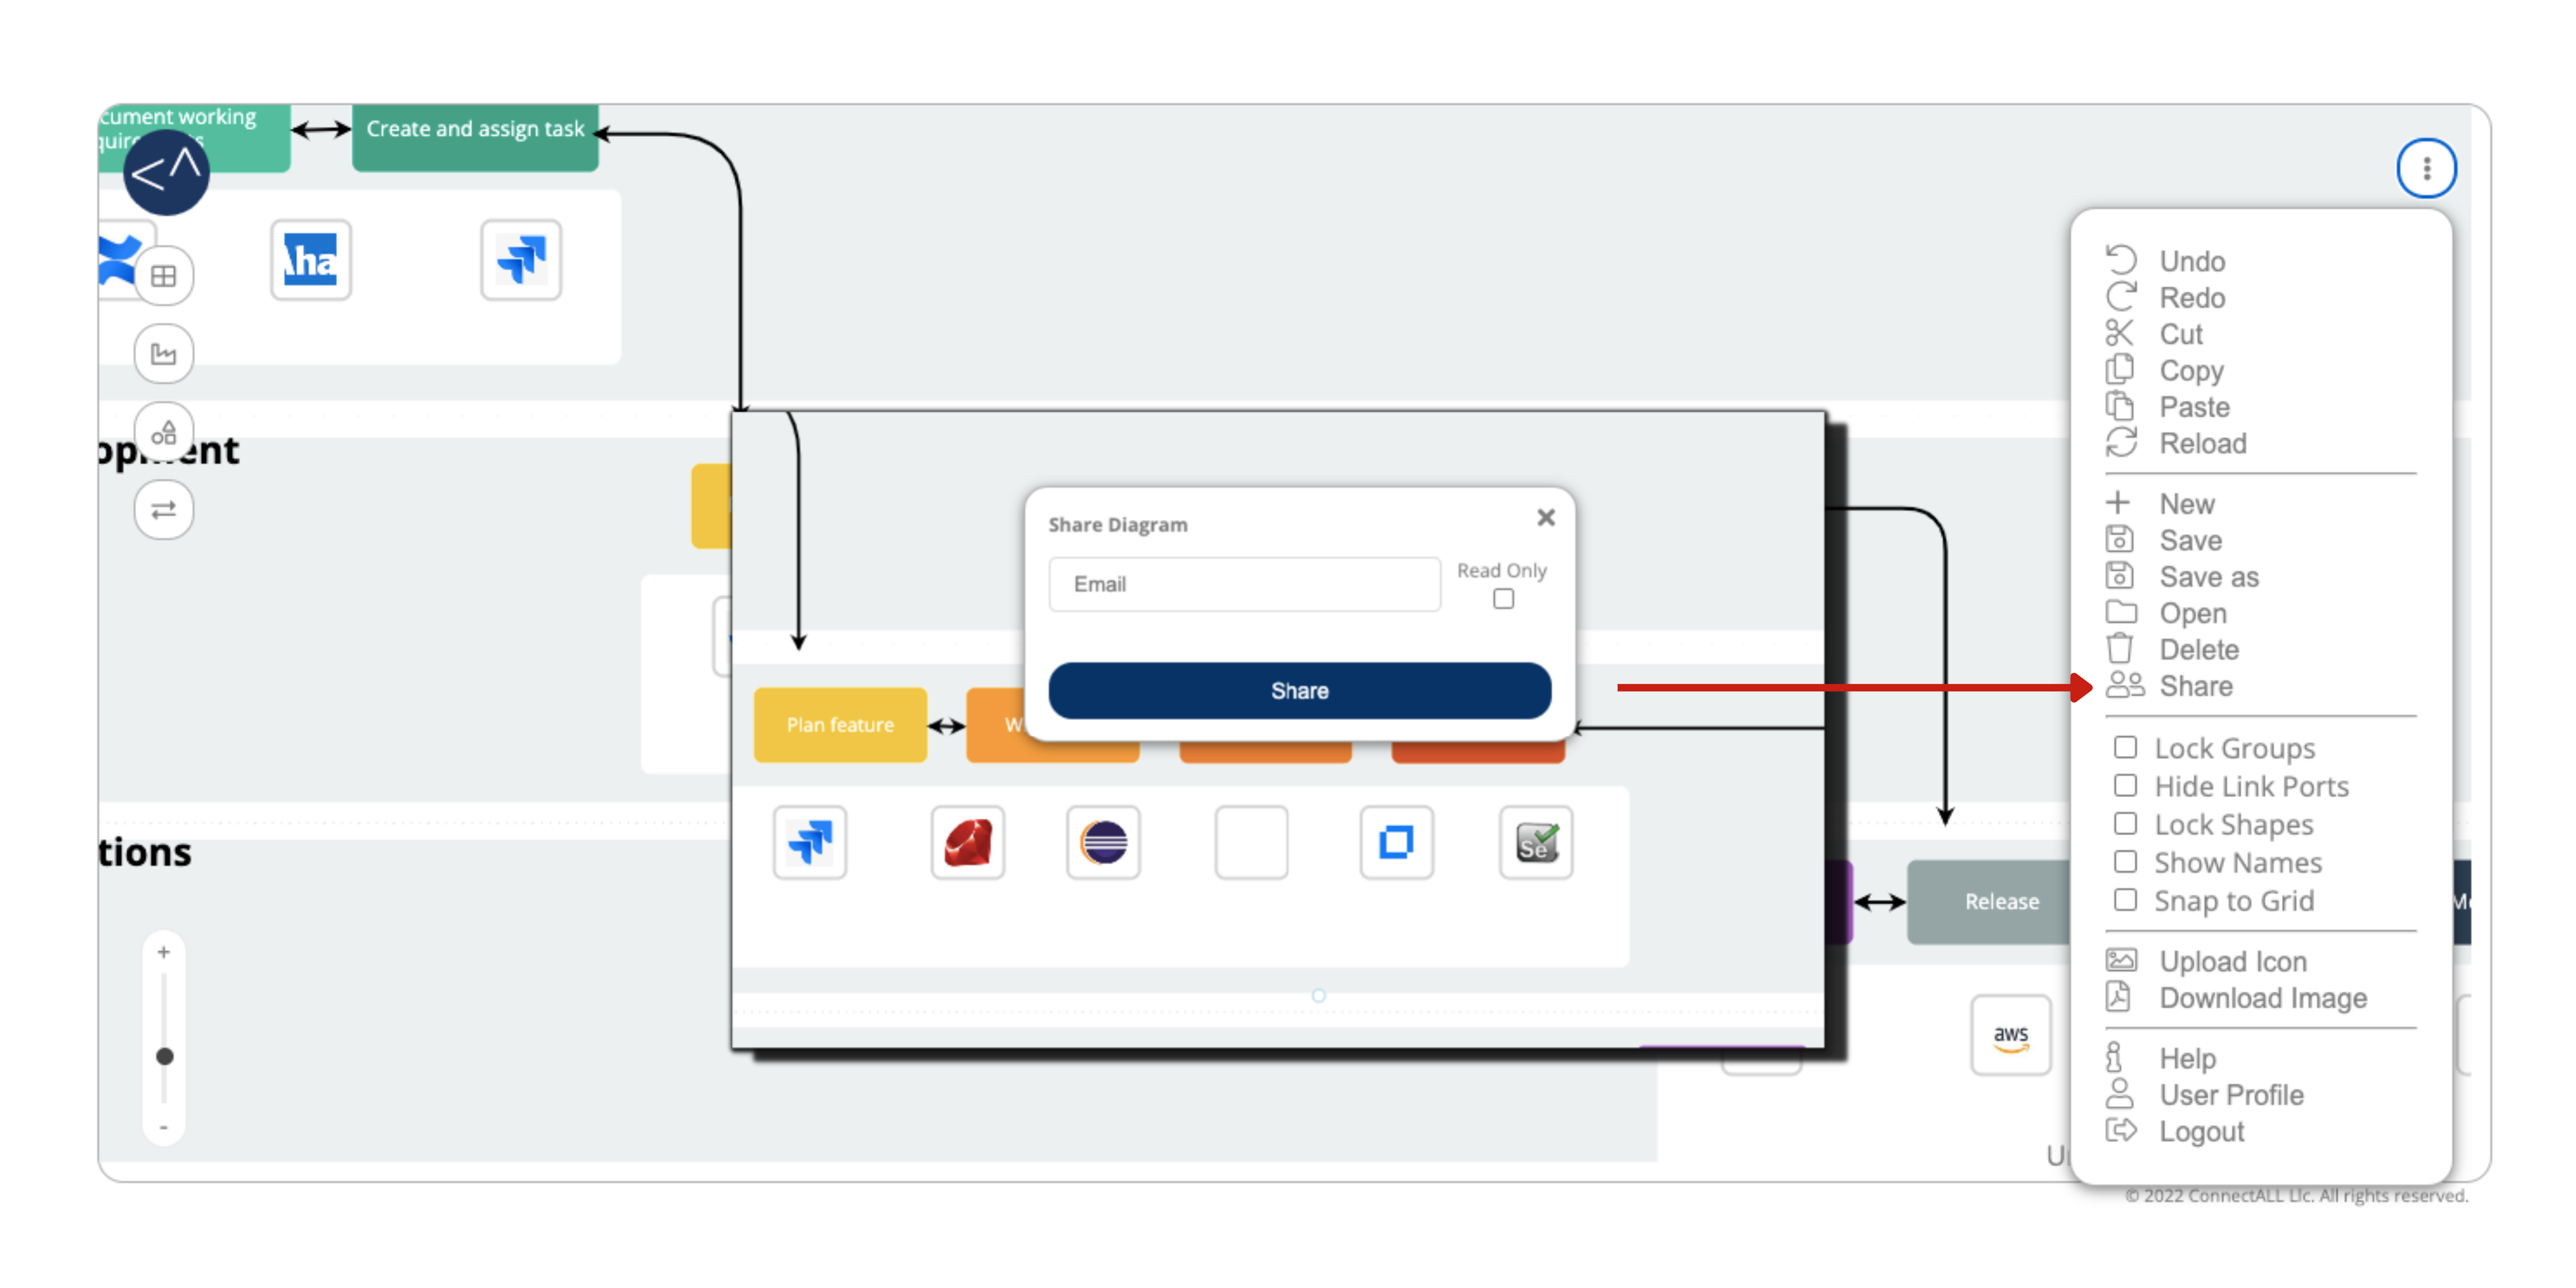
So, you are done with your diagram, now what? You could easily share it with a team member or any other stakeholder involved in your project. You could make the file read-only or you could let the person comment on the diagram, or simply use it to conduct virtual brainstorming sessions. But, remember before you learn how to share a diagram, you will be able to share it only with a registered user.
To share a diagram:
- Click the three vertical dots menu and click Share. The Share Diagram dialog box will be displayed.
- Enter the email address of the user you want to share with. If you do not want the user to edit the diagram, click to select the Read-Only option.
- Click Share. You will receive a confirmation that an email has been sent to the user with a link.
You can also download a diagram and save it for later use. And as mentioned before, you can use them to conduct brainstorming sessions or presentations or even take a printed copy for show and tell.
Now that you have all the information you need, we expect you to have fun while also seriously mapping your value streams. Share your fun diagrams on your social profiles and hashtag #funwithvaluestreamdesigner and tag ConnectALL or simply email it to us at ma*******@co********.com. A backstory will also be a great addition.
Need help? Reach out to our value stream architects for a 2-hour complimentary workshop.

Head of Content Marketing at ConnectALL, responsible for communication and content marketing strategy. For two decades, I’ve assisted businesses to integrate content marketing into their marketing plans to achieve their business goals. I specialize in creating and developing content (inbound and outbound) across various online and offline channels from websites, blogs, and social media to email marketing and marketing communication collateral.
